Calculating Carbon Footprint Through Lifecycle Assessment Pilot
June 22, 2022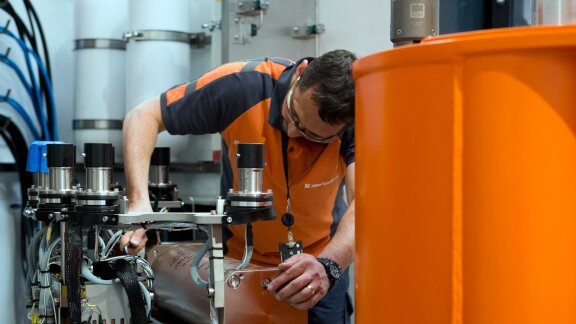
The carbon footprint of this module was analyzed with a cradle-to-grave approach to enable decision makers to evaluate suppliers and logistics, as well as other factors affecting carbon emissions. The results showed that the largest emissions are from the raw components of the product, field operations and the maintenance activities.
Challenge
Aker Solutions’ Climate Action Plan is driving several initiatives through the organization to better understand emissions and to make improvements to environmental performance. Fully understanding a product’s carbon footprint helps identify those with the largest emissions and the reasons for those emissions, including factors like sourcing raw materials, manufacture, and logistics and operations. In this way, we can perform a lifecycle assessment (LCA) of the product.

Calculating the carbon footprint of a product is a complex task requiring accurate information from several sources. Some of this information is generically available in industry databases which is helpful to use to compare and obtain trends.
However, only detailed information from suppliers can provide the actual carbon footprint for a product. This is the data Aker Solutions is proposing to use, when possible, throughout this ambitious project which aims to develop a carbon footprint for each product.
Approach
The project team selected the subsea control module as the pilot study for the carbon footprint dashboard. Since the control module has many components, this LCA offers excellent insight into scope 3 emissions in general.
Using SimaPro LCA software, the subsea team in Brazil modelled the carbon emissions associated with the control module. They evaluated the main contributors of carbon emissions and created a tool to assess different scenarios to improve the carbon footprint. In the case of the subsea control module, the team compared manufacturing locations in Brazil versus Malaysia and also the impact of different transport options on the emissions.
The LCA project has drafted a procedure for lifecycle emissions within Aker Solutions with the aim to use one approach and one tool for all products and departments. In time, dashboards will make the information available to decision makers from a central platform and will also include cost and schedule information.
Outcome
The LCA of the subsea control module yielded some interesting results. The element of the subsea control module with the largest carbon footprint is component manufacture and distribution, coming in at 48 percent. This is followed by electricity consumption during the use phase at 34 percent. Production and supply of stainless steel for manufacturing is the biggest raw material impact and air freight accounts for six percent of the lifecycle.
Scenario analysis shows that replacing aircraft with oceanic vessels in the supply chain would make an immediate reduction of six percent in the footprint. As these modules are manufactured in Brazil, moving them to Norway for projects increases their carbon footprint significantly. This is especially true if a large number of modules are moved by air. The carbon footprint of air freight could rise to 26 percent with a 63 percent ratio of air to ship movements.
Based on the success of the pilot phase, the LCA project will be expanded to other Aker Solutions products and services. The goal is to build dashboards for each product for better business decision-making.
This tool can also enable tender and project managers to perform scenario analyses to reduce their carbon footprint and see impacts to cost and schedules, e.g., selecting different sourcing options can show the emissions impact from raw materials production as well as logistics impacts.